A major leap forward in operational intelligence — embedded directly in the CXT platform. Get dynamic reporting, trend analysis, and profitability visibility across performance, SLA adherence, and route efficiency. No reporting expertise required.


Most courier operations still depend on someone who knows the report builder, the spreadsheet, or the SQL query. By the time the export is pulled, the rows are cleaned, and the chart is built, the SLA breach has already happened, the margin has already eroded, and the customer is already on the phone.
When every dashboard requires SQL, an analyst, or a custom build, the questions your operators need answered today don’t get answered until next week.
Yesterday’s on-time rate doesn’t help today’s dispatcher. By the time a metric surfaces, the route is already late and the customer has already noticed.
Revenue per customer, cost per stop, profitability per route — buried in raw data your finance team has to chase down line by line.
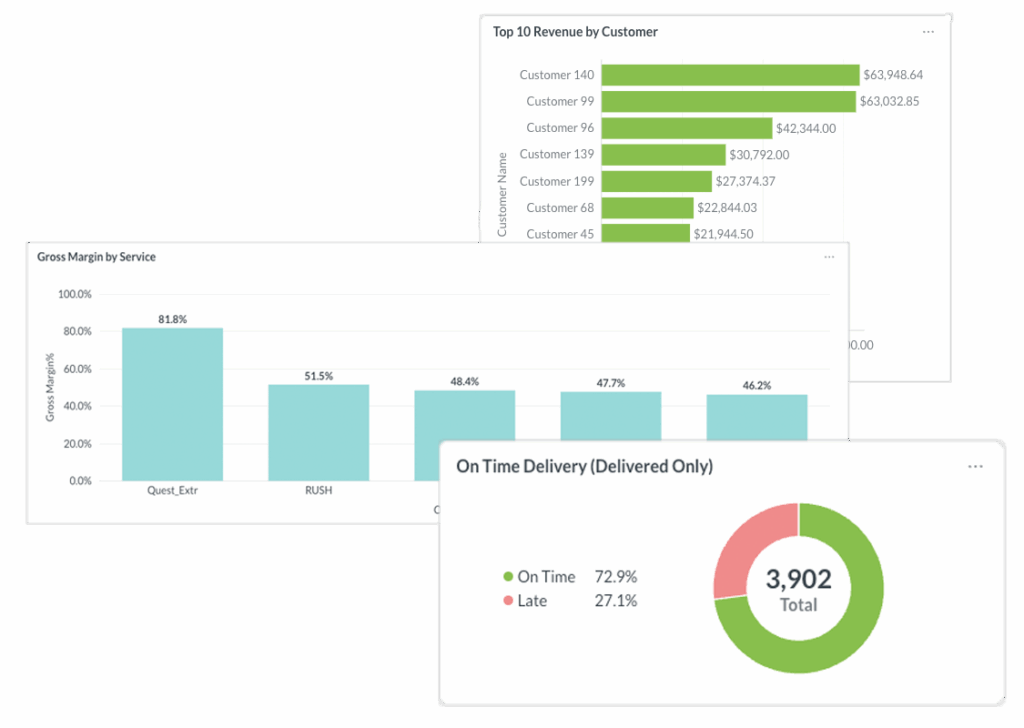
The Analytics Dashboard transforms your CXT operational data into actionable insights across the four areas that decide whether a courier business wins or loses. It’s already on the day you turn it on. No data warehouse to build. No analyst to hire. No reporting expertise required.
On-time rates, driver productivity, and exception trends — at the dispatch board, the driver, and the route. Live.
Real-time SLA scoring across your fleet and every third-party courier. Catch the breach before the customer does.
Profitability and on-time performance by route, lane, and stop density — fix unprofitable routes from data, not gut feel.
Revenue, cost, and margin by customer, route, and service type — without waiting for the close of the quarter.
Get the views that matter most to your logistics operation: on-time performance by driver, route, customer, or time period. Order volume and trend analysis. Driver productivity and compliance. Revenue, margin, and billing verification. Vendor and SLA scorecards. Exception reports for late deliveries, missing PODs, and compliance flags.
No services engagement. No SQL. No spreadsheet wrangling. Just the answers, where your team can already see them.
The Analytics Dashboard lives inside the platform your operations team already runs on — no second tool to log into, no external warehouse to sync. It ingests data from native CXT orders and operations, third-party courier integrations, API-connected systems and vendors, route optimization tools, and mobile driver app activity.
The result is unified visibility — whether the work was fulfilled by your internal fleet or handed to a partner — without ever leaving the dispatch board.
The Analytics Dashboard meets each of our logistics market segments where they are — with views, metrics, and proof points calibrated to the work they’re accountable for.

For specimen, lab, and pharmacy couriers, every late pickup is a clinical risk and every compliance gap is an audit exposure. The Analytics Dashboard surfaces what your operations and quality teams need to see — at the route level, in real time.

If you manage an expansive fleet across industries or regions, the Analytics Dashboard consolidates your entire network into one view. Compare drivers head-to-head, catch piece-count discrepancies before they hit a customer’s invoice, and hold every team to the same SLA.

Executive dashboards roll the whole operation up: month-over-month volume and revenue trends, fleet utilization and driver productivity, customer health based on delivery performance, and comparative performance across business units.
Fewer hours per week spent on billing reconciliation, after replacing manual spreadsheets with scheduled Analytics Dashboard reports.
Less time chasing updates. Multi-region carriers turn delivery management from a daily fire drill into a weekly review.
Orders per day, the volume the Analytics Dashboard handles without performance degradation.
Results may vary by deployment and use case.
Surface SLA risk before customers call
Real-time visibility into where every order stands
Objective driver and route accountability
Capacity planning anchored in actual peak data
Validate invoices against actual deliveries in minutes
See profitability by customer, route, service type
Replace the spreadsheet eating away at your week
Avoid BI platform complexity and hefty investments
Strategic, data-backed decision-making
Customer retention intelligence from delivery signals
Spot growth and expansion in your existing book of business
Benchmark performance across locations
Get ahead of issues before they escalate
Walk into QBRs with hard performance data
Resolve disputes with detailed delivery records
Prove SLA adherence with objective metrics
See how the Analytics Dashboard turns your CXT data into actionable insights across performance, SLA adherence, route efficiency, and profitability — embedded in the platform your team already uses every day.
Schedule a call with our team for a personal walk-through of the Analytics Dashboard in action.
Ready to boost delivery efficiency, cut costs, tighten compliance, and simplify your day-to-day?
Our team is standing by to discuss your business needs and help lay out a plan for intelligent, autonomous delivery management.
Pick a day and time that works for you, and let’s chat about your goals.

Ready to boost efficiency, cut costs, and simplify your day-to-day?
Pick a time that works for you, and let’s chat about your business goals.
Thank you for opting in.